


The performance graphics have arrived to Clouding
In Clouding we’re working day in, day out to improve the plataform, so that you enjoy the best cloud service.
Following up with this continuous improvement, transparency and simplicity motto, we’ve incorporated to the control panel the performance graphics of your cloud server.
This feature will allow you to be informed in a very detailed way and in real time about the performance of the resources that you have chosen for your vps cloud server.
This way, you can make decisions regarding your server’s resources with all the data you need just one clic away.
The performance graphics are available in your control panel. If you click on the server’s name, you can see the “Statistics” tab on the right side.
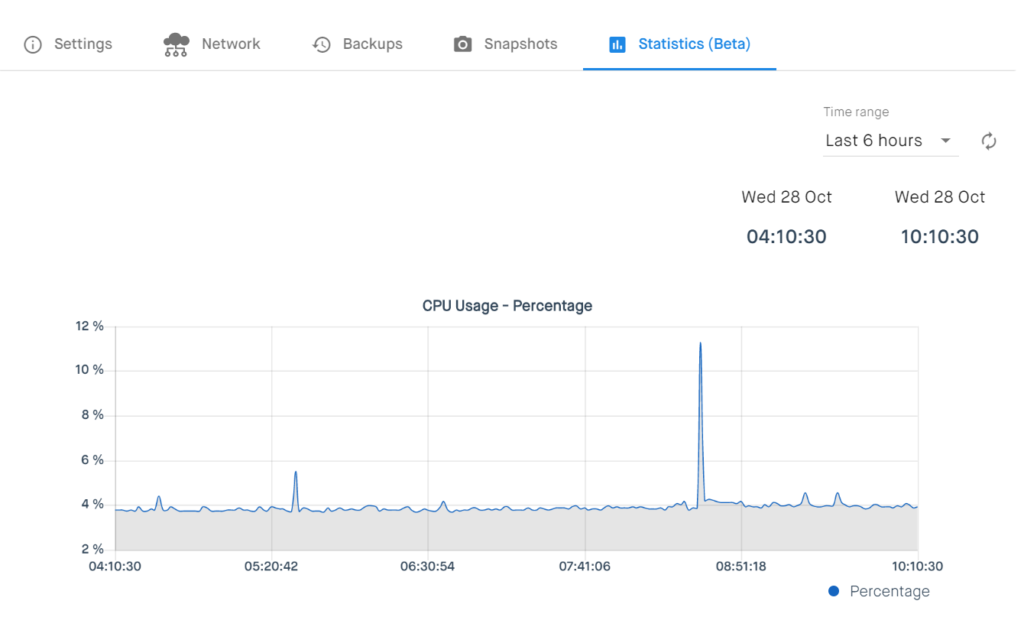
The data that you can check out on the graphics with accurate precision are the following:
- The CPU usage percentage.
- The operations per second (iops) of reading and writing to disc.
- The Bytes per second (Bps) of reading and writing to disc.
- The Bits per second (bps) received and sent through the public net.
- The packets per second (pps) received and sent through the public net.
- The Bits per second (bps) received and sent through the private net.
- The packets per second (pps) received and sent through the private net.
In our knowledge base you have an article about how to view the performance graphics.
We hope that you like this new feature and that it’s useful to you!
If you have questions about the performance graphics, you can call us or email us to [email protected].
We’ll be happy to help you out 🙂
Leave a Reply